Deep Dive into Instana AI Observability
Table of Contents generated with DocToc
Deep Dive into Instana AI Observability
Background
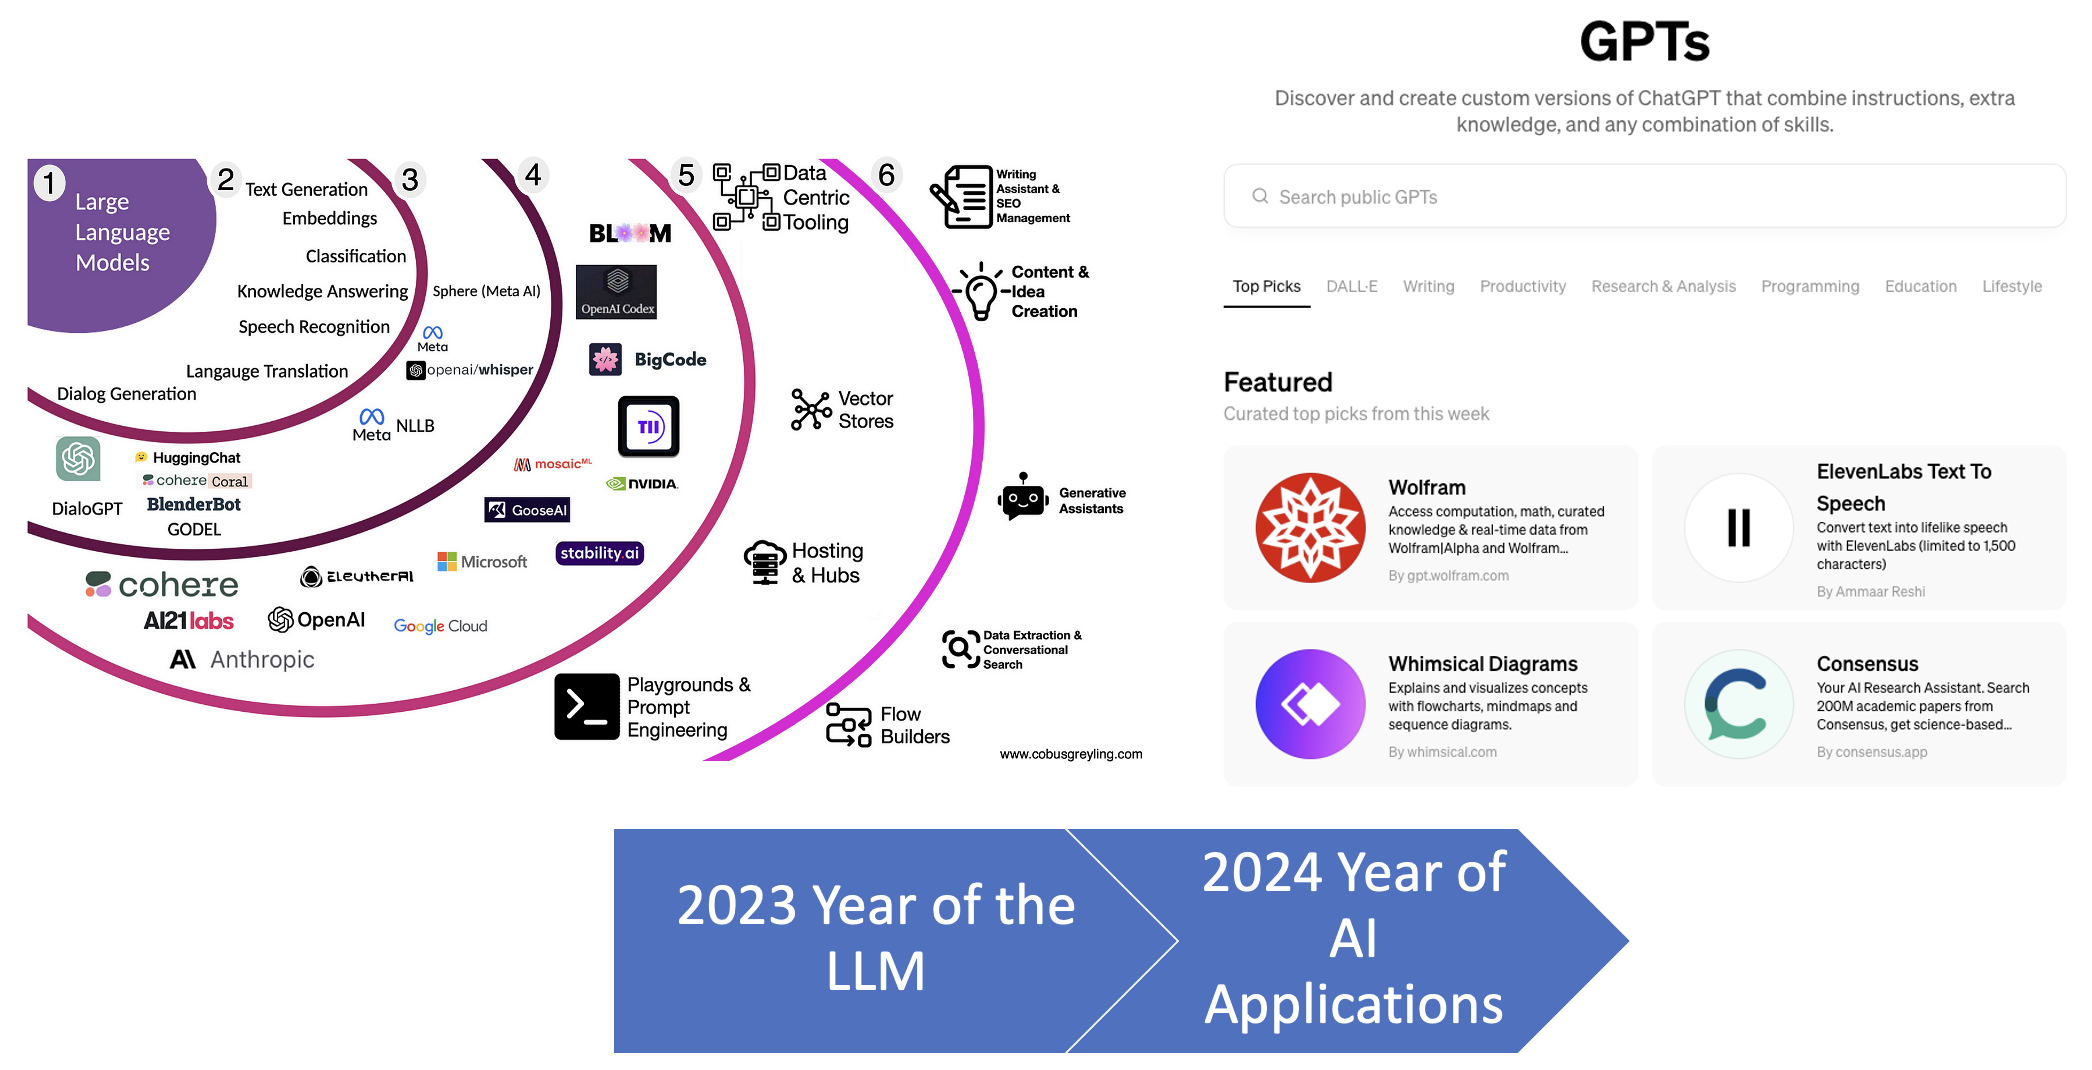
In 2023, Large Language Models (LLMs) like OpenAI’s GPT series garnered significant attention for their ability to generate human-like text, answer questions, write code, and more. This was indeed a pivotal year for LLMs as they became more mainstream, with increased usage across various sectors including education, customer service, content creation, and programming assistance.
As we move into 2024, the focus seems to be shifting towards the application of AI technologies, including but not limited to LLMs, into more specialized and practical applications. This includes areas such as: Healthcare, Finance, Manufacturing, Automotive and Transportation, Entertainment and Media etc.
The transition from a focus on the underlying technologies (like LLMs) to their applications suggests a maturation in the AI field. Businesses, governments, and individuals are increasingly looking for ways to leverage AI to solve specific problems, improve efficiency, and create new opportunities. This shift also reflects a growing recognition of the need for AI to deliver tangible benefits and for its deployment to be guided by considerations of ethics, fairness, and societal impact.
The year 2024 may indeed be seen as the “Year of AI Applications,” highlighting a phase where the potential of AI and LLMs is being realized across a broad spectrum of real-world applications, bringing significant changes to industries and society at large.
Key Features of AI Observability
Building production AI applications indeed requires a robust framework for AI observability. As AI systems, particularly those based on machine learning (ML) and large language models (LLMs), become more integral to business operations and consumer products, ensuring their reliability, fairness, performance, and security is paramount. AI observability goes beyond traditional monitoring to provide deep insights into the behavior of AI models in production, allowing developers and operations teams to understand not just what is happening, but why it’s happening.
The following are the key features for AI Observability:
-
Model Performance Monitoring: Tracks the accuracy, speed, and efficiency of AI models in real-time. This involves monitoring the model’s predictions, throughput, and latency to quickly identify and address performance degradation or anomalies.
-
Data and Feature Drift Detection: Since AI models are trained on historical data, any change in the underlying data distribution (data drift) or in the statistical properties of the model features (feature drift) can significantly affect the model’s performance. Observability tools can detect these changes in real-time, alerting teams to potential issues.
-
Explainability and Transparency: Given the often “black box” nature of AI models, especially deep learning models, it’s crucial to have tools that can provide insights into how models make decisions. This is essential for debugging, regulatory compliance, and building trust with users.
-
Fairness and Bias Monitoring: AI systems can inadvertently perpetuate or amplify biases present in their training data. Observability must include mechanisms to detect and mitigate bias across different demographic groups to ensure fairness and compliance with ethical standards.
-
Model Health and Lifecycle Management: This involves tracking the versioning, deployment, and retirement of models. It’s important to have a holistic view of the model lifecycle to manage dependencies, updates, and deprecations effectively.
-
Security and Compliance: Ensuring that AI applications adhere to relevant regulations and standards is critical. Observability tools should monitor for potential security vulnerabilities in the model or the data it processes and ensure compliance with data protection laws.
Inside Technologies
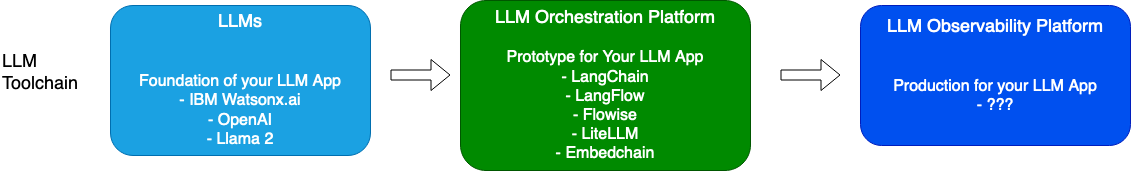
Instana has been integrated with OpenTelemetry for AI Observability. It is leveraging Traceloop to integratew ith different OpenTelemetry Instrumentation to integrate with different LLM providers.
OpenTelemetry Instrumentation
In order to make a system observable, it must be instrumented: That is, code from the system’s components must emit traces, metrics, and logs.
The major component that we used in OpenTelemtry is OpenTelemtry Collector. It is astandalone service that receives, processes, and exports telemetry data. It can be configured to receive data from multiple sources and send it to various backends.

OpenTelemtry Collector mainly contain three components including receiver, processor and exporter.
- Receivers
- Receivers are the entry points for data into the OpenTelemetry Collector. They are responsible for receiving telemetry data from various sources. Receivers can accept data over different protocols (e.g., HTTP, gRPC) and formats (e.g., Jaeger, Prometheus, Zipkin for traces, and metrics). There are two types of receivers:
- Push-based receivers: Where data is sent by the application or infrastructure to the collector.
- Pull-based receivers: Where the collector polls and fetches data from a source.
- Processors
- Processors sit in the middle of the data pipeline, between receivers and exporters. They are responsible for transforming, filtering, batching, and enriching telemetry data before it is exported. Processors can perform a wide range of functions, such as:
- Batching: Combining multiple data points into a single batch to reduce the number of outgoing calls.
- Filtering: Removing unnecessary or sensitive information from the data.
- Modifying: Enriching the data with additional information or altering existing fields.
- Sampling: Reducing the volume of trace data by selecting a representative subset.
- Exporters
- Exporters are responsible for sending the data to one or more destinations where it can be analyzed and visualized. These destinations could be analytics platforms, observability tools, or custom services. Exporters are designed to be flexible, allowing telemetry data to be sent to different backends, supporting various protocols and data formats. Similar to receivers, exporters can support either push or pull models, depending on the backend’s requirements.
Traceloop
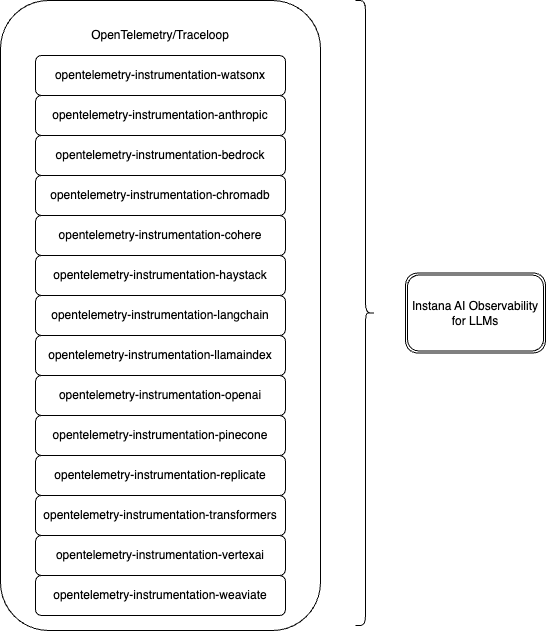
Traceloop is an open-source project which provides a set of tools and libraries for collecting and visualizing metrics from LLMs. OpenLLMetry is the core projects that can be used with Traceloop or other observability platforms.
OpenLLMetry mainly contain two parts:
-
Instrumentation for different LLM providers, you can check here to get all of the instrumentation codes.
- LLM Providers
- IBM Watsonx AI
- OpenAI / Azure OpenAI
- Anthropic
- Cohere
- HuggingFace
- Bedrock (AWS)
- Replicate
- Vertex AI (GCP)
- Vector DBs
- Chroma
- Pinecone
- Qdrant
- Weaviate
- Milvus
- Frameworks
- LLM Providers
-
traceloop-sdk
Instana Integration
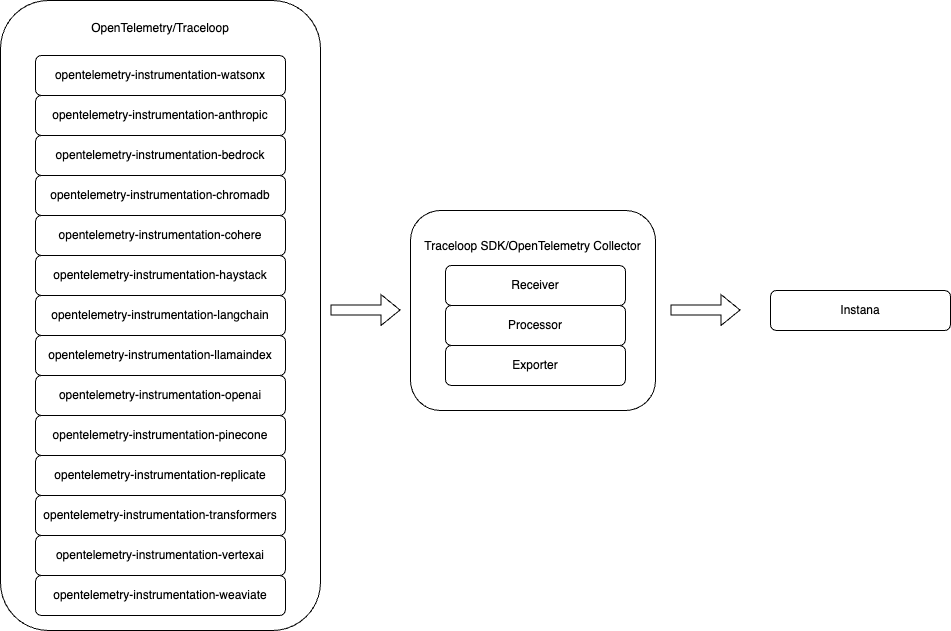
For AI Observability with Instana, we can see that with Traceloop/OpenTelemetry Integration, Instana is just a backend for OpenTelemetry Collector and it will receive AI Observability data from Traceloop SDK and display all of the data in Instana dashboard.
Tracing
- Trace the entire lifecycle of every LLM Response: Enable end user to see the entire end-to-end lifecycle of the response. Starting from the prompt through all the stages in the application components with an easily understandable waterfall view as seen in the screenshot below.
- The following picture is an example of Instana is able to show the tracing of LangChain and OpenAI, you can get the sample app from here.

Unified AI Visibility
- If you are using multiple LLM providers, Instana is able to show an overview of metrics from all LLM providers, so that you can have a clear view of the model latency, token usage, token cost etc.
- Customer can easily identify outliers and trends: Unified visiability provides a consolidated, roll-up view of all AI responses. This makes it easy to identify outliers and trends in your responses.

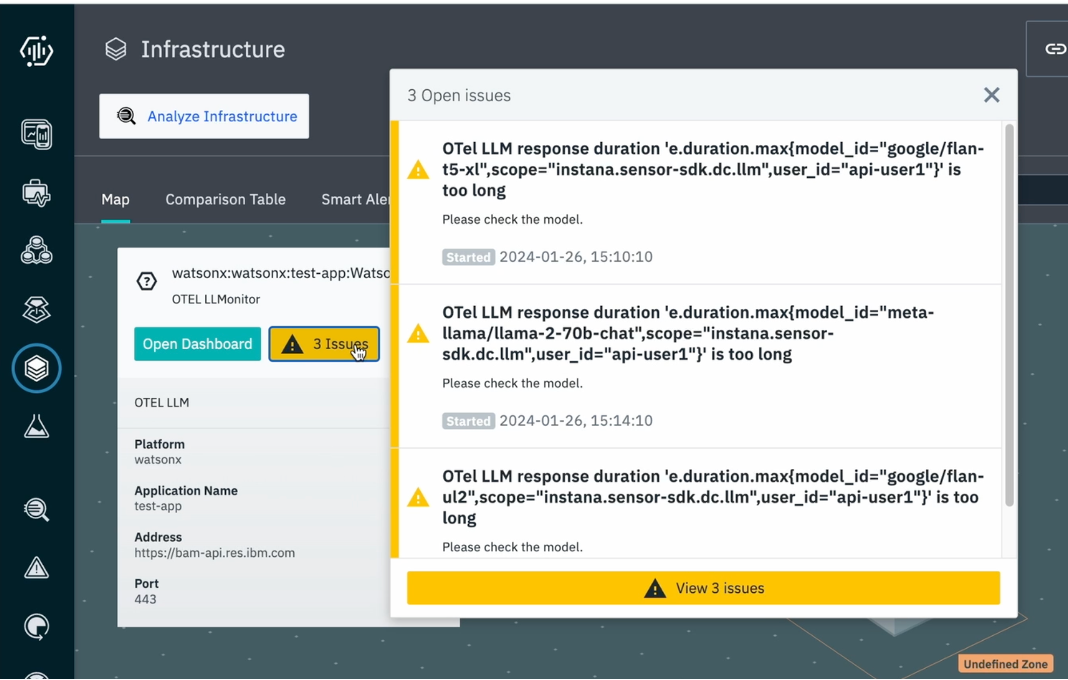
Events and alerts
Events and Alerts are based on metrics. After Instana get all AI Metrics from OpenTelemetry, it will able to generate events and alerts based on those metrics.
- Proactive problem detection: Identify and address issues before they significantly impact your systems or applications.
- Improved visibility: Gain insights into the health and performance of your IT infrastructure.
- Faster troubleshooting: Quickly identify the root cause of problems with detailed information in alerts.
- Reduce downtime: Proactive measures based on alerts can prevent major outages and minimize downtime.
Quick Start
Config Instana
To configure, simply follow the Instana Traceloop Integration steps, and enable a GRPC connection for the Instana Agent.
Running Test Code
You can get all the test codes for different LLM providers from traceloop sample app.
Good Luck!