OpenTelemetry Profiling with Elastic OTel Profiling Agent
Table of Contents generated with DocToc
OpenTelemetry Profiling with Elastic OTel Profiling Agent
OpenTelemetry Profiling Overview
OpenTelemetry profiling is a feature within the broader OpenTelemetry observability framework that focuses on capturing performance data about application runtime and system behavior. Profiling in this context is generally used to identify resource usage and performance bottlenecks within an application. It provides detailed insights into how code executes, which can be crucial for optimizing performance and understanding complex issues in production environments.
What Profiling Measures
- CPU Usage: Understanding which parts of your application are consuming the most CPU time.
- Memory Allocation: Tracking memory usage and identifying memory leaks or areas of inefficient memory use.
- Thread Activity: Analyzing thread usage and synchronization issues, which can help in identifying concurrency problems or deadlocks.
Integration with Telemetry Data
Profiling data can be integrated with other types of telemetry (traces, metrics, logs) provided by OpenTelemetry. This integration allows developers to correlate high resource usage or performance bottlenecks with specific traces or log entries, providing a comprehensive view of application behavior.
Some integration examples as follows:
- Metrics to profiles: You will be able to go from a spike in CPU usage or memory usage to the specific pieces of the code which are consuming that resource.
- Traces to profiles: You will be able to understand not just the location of latency across your services, but when that latency is caused by pieces of the code it will be reflected in a profile attached to a trace or span.
- Logs to profiles: Logs often give the context that something is wrong, but profiling will allow you to go from just tracking something (Out Of Memory errors, for example) to seeing exactly which parts of the code are using up memory resources.
Sampling
Profiling often uses sampling techniques to periodically capture data about the application’s state. This approach reduces the overhead of profiling, making it more suitable for production environments. The sampling rate can usually be adjusted based on the level of detail required and the performance impact on the application.
Granularity
The granularity of profiling data can vary, from high-level overviews of system performance to detailed breakdowns of function calls and execution paths. The level of detail captured typically affects the performance overhead, so it needs to be managed according to the specific use case.
Tooling and Visualization
Tools and visualizations play a crucial role in profiling. OpenTelemetry does not directly provide a profiling tool yet but Elastic is going to donate its profile agent to OpenTelemetry. After get all of the profiling data from profile agent, we also need platforms that specialize in data visualization and analysis. This data can be used in conjunction with other observability tools to provide actionable insights.
Elastic Otel Profiling Agent
Elastic Otel Profiling Agent implements a whole-system, cross-language profiler for Linux via eBPF. It supports C/C++, Rust, Zig, Go, etc. without debug symbols on host.
Build the Agent
As the profiling agent did not release yet, so I was building the agent myself via dockerfile:
make docker-image
make agent
The resulting binary will be in the current directory as otel-profiling-agent.
Visualizing Data
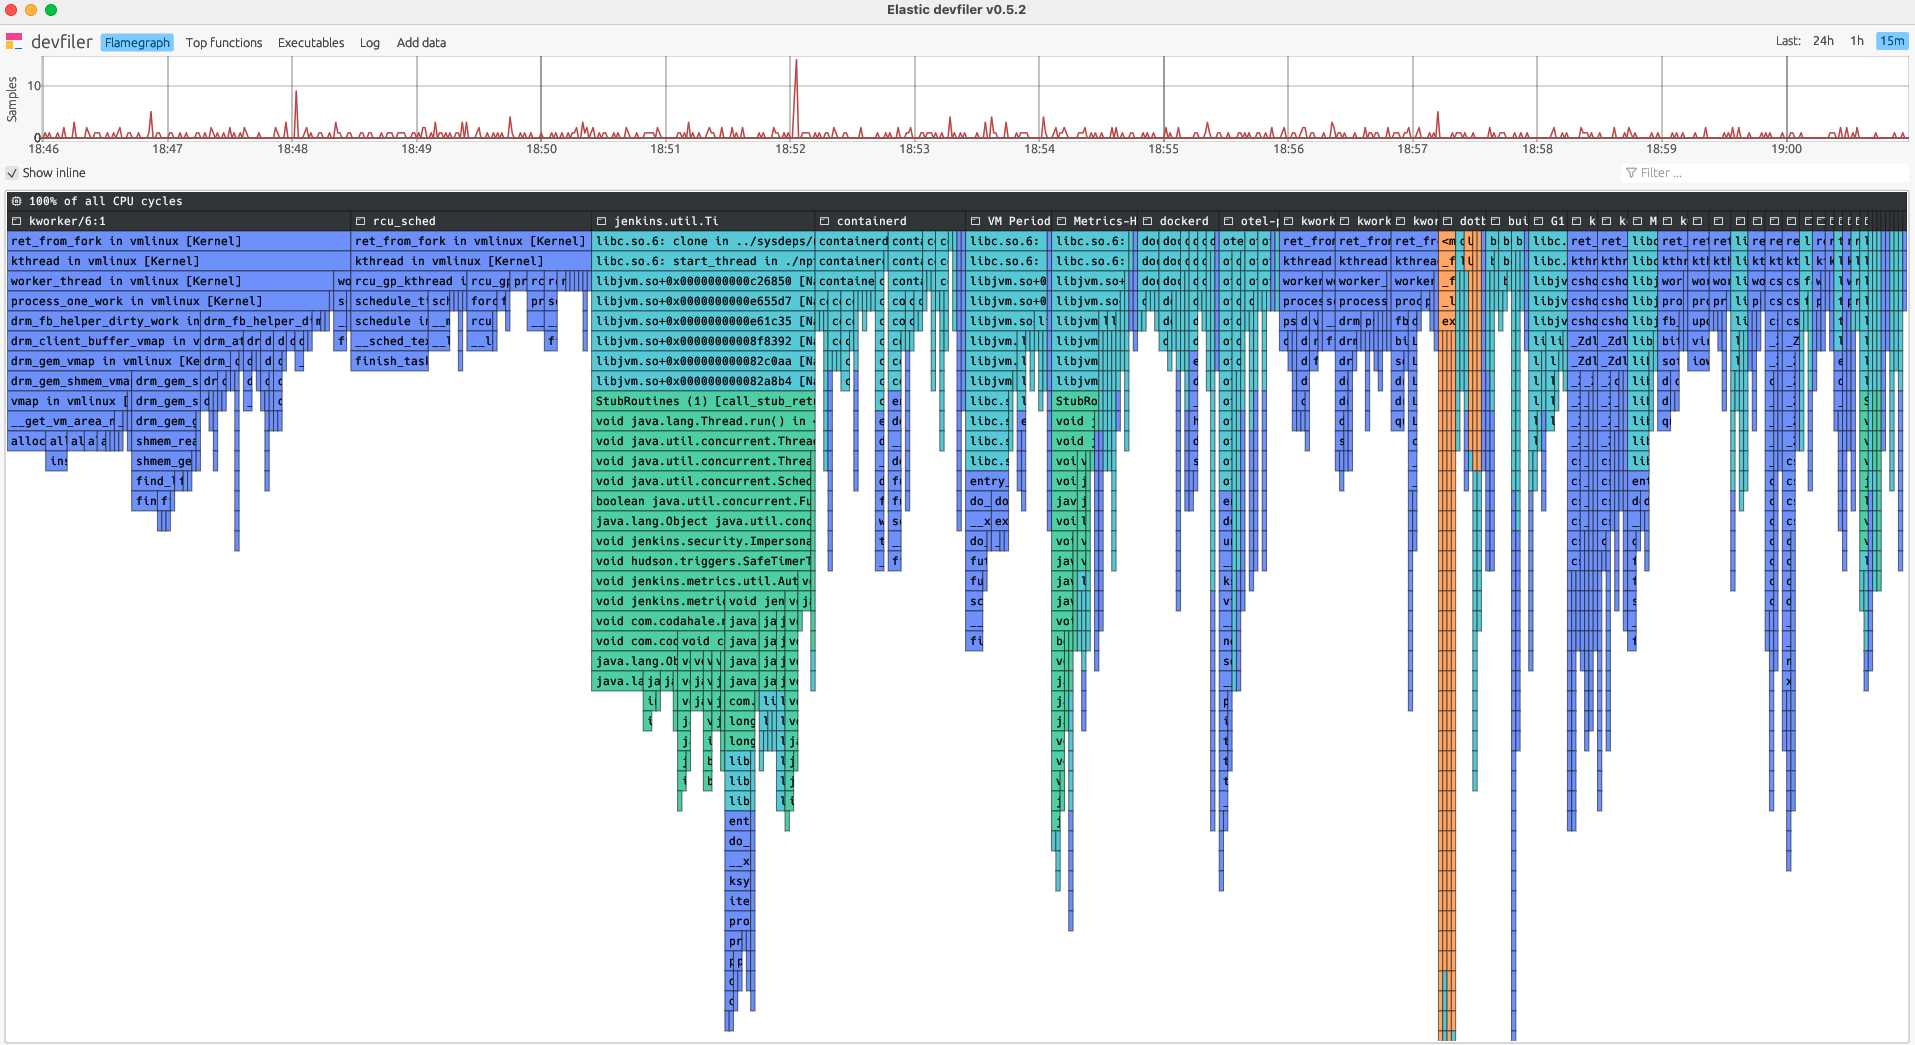
Elastic created a desktop application called devfiler that allows visualizing the profiling agent’s output locally, making it very convenient for development use. devfiler spins up a local server that listens on 0.0.0.0:11000.
I was using MacOS release (Seems other releases does not work for my platform) for test.
Run Agent and devfiler
- Do a right-click on
devfilerapp on MacOS, then chooseOpen. - Run profiling agent via the following command:
sudo ./otel-profiling-agent -collection-agent=<devfiler host>:11000 -disable-tls
OK, all set.
View profiling on devfiler
Flamegraph
Top Functions

Executables

Logs
