The Future of Observability Is Open: A CNCF Perspective
Table of Contents generated with DocToc
- The Future of Observability Is Open: A CNCF Perspective
- The Role of CNCF TAG Observability
- Open Observability Platform
- Putting It All Together: OTel Native + CNCF Ecosystem
- Key Benefits of an Open, CNCF-Driven Observability Approach
- Practical Steps to Get Started
- Looking Ahead
- Conclusion
The Future of Observability Is Open: A CNCF Perspective
Observability has become indispensable for running modern, distributed systems in a reliable and efficient manner. As cloud-native technologies grow in adoption and complexity, the need for standardization, collaboration, and community-driven innovation has never been greater. The CNCF TAG Observability (Technical Advisory Group) plays a pivotal role in shaping this future by guiding best practices, driving open standards, and fostering collaboration across the ecosystem.
In this post, we’ll explore why the future of Observability is open, how CNCF TAG Observability and emerging tools fit into that vision, and how ongoing efforts—like OpenTelemetry Entities, Perses, and unified query languages are transforming the way we collect, analyze, and visualize telemetry data.
The Role of CNCF TAG Observability
The CNCF TAG Observability is a collaborative forum within the Cloud Native Computing Foundation that focuses on advancing Observability standards, projects, and practices. It provides:
Community-Driven Standards and Best Practices
By bringing together end users, vendors, and open-source contributors, TAG Observability drives alignment on everything from instrumentation to data formats and best practices for distributed systems monitoring.
Project Guidance and Collaboration
The CNCF hosts numerous Observability projects—like Prometheus, OpenTelemetry, Jaeger, and more. TAG Observability helps ensure these projects complement each other and follow consistent design principles and patterns.
Focus on Interoperability
One of the biggest benefits of cloud-native Observability is the ability to mix and match tools without creating data silos. TAG Observability encourages open APIs, protocols, and data models so that metrics, logs, and traces can flow seamlessly between different back-end solutions.
Open Observability Platform
The following is an overview of how the Open Observability Platform will be looks like, all the components are from open source. You can build this platform from scratch with those open source projects.
OpenTelemetry as the Cornerstone
At the heart of modern, open Observability is OpenTelemetry (OTel), a CNCF project that provides a vendor-neutral set of libraries, APIs, and semantic conventions for collecting and transmitting telemetry data. Its key components SDKs, APIs, and the OpenTelemetry Collector will offer the following:
- Unified Data Collection: Instrument once using OTel, and send metrics, logs, and traces to any supported backend or APM solution.
- OTLP (OpenTelemetry Protocol): A common protocol for shipping telemetry data, reducing fragmentation and paving the way for cross-vendor interoperability.
- Semantic Conventions: Guidelines that define consistent naming and structure for data, making it easier to build dashboards, alerts, and analytics across disparate systems.
OpenTelemetry’s widespread adoption signals a broader shift: organizations want open, community-backed solutions that avoid lock-in and scale with their needs.
The Emergence of OTel Entities
While OpenTelemetry has traditionally focused on instrumentation for metrics, logs, and traces, the community is now expanding its scope to include “entities.” The OpenTelemetry Entities OTEPs define a framework for modeling resources, relationships, and context in Observability data.
What Are OTel Entities
Resources and Relationships
Entities can represent services, hosts, containers, or even more abstract constructs like business transactions or SLOs. By defining relationships between these entities, OTel aims to provide a richer, more holistic view of your system’s topology.
Consistent, Context-Rich Observability
With entity definitions, you can associate metrics, logs, and traces not just with a generic “resource,” but with a well-defined object in your system. This makes it easier to correlate data across services and track how changes in one entity affect others.
Dashboards and Visualization
As the specification matures, it will enable dashboards and visualization tools to automatically discover, group, and link entities—streamlining root-cause analysis and enabling advanced analytics (e.g., showing all downstream dependencies of a failing service).
Benefits of Entity-Centric Observability
- Topology Awareness: Understand the dependencies and interactions between microservices, databases, caches, etc.
- Clearer Ownership: Associate telemetry data with specific teams or owners, making it simpler to manage alerts and SLOs.
- Richer Analysis: With entity relationships in place, machine learning or anomaly detection algorithms can better identify patterns and potential failure points.
Expanding the Observability Stack
Beyond Instrumentation: Data Pipelines
Collecting telemetry data is only the first step. The data pipeline—how logs, metrics, traces, and now entity information are processed, transformed, and stored—plays a crucial role in overall Observability. Projects like the OpenTelemetry Collector allow you to:
- Filter and Sample high-volume data to manage costs and noise.
- Enrich telemetry with contextual information (e.g., Kubernetes labels, resource relationships).
- Export data to multiple destinations (e.g., Prometheus, Jaeger, Elasticsearch) simultaneously.
A Unified Observability Database
After data is collected and processed, the next challenge is storage. While you can choose best-of-breed backends for each data type—Prometheus for metrics, Loki for logs, Tempo for traces, etc.Organizations increasingly seek a unified observability database that supports OTLP or similar open standards. This ensures:
- Consistent Context across logs, metrics, traces, and now entity relationships.
- Streamlined Troubleshooting by reducing the need to switch between multiple data stores.
- Lower Operational Overhead with fewer systems to maintain.
A Unified Query Language
One of the most exciting developments in the Observability community—championed by CNCF TAG Observability—is the push for a unified query language that can query logs, metrics, traces, and entities in a single, cohesive manner. Currently, we juggle multiple languages, and the final decision will go with SQL-like.
- PromQL for Prometheus metrics
- LogQL for Loki logs
- SQL-like or custom DSLs for trace queries in Jaeger, Tempo, or other tracing backends
A unified query language aims to abstract away these differences, so teams can ask questions about their systems without constantly switching syntaxes or tools. The benefits include:
- Reduced Cognitive Load: Engineers only need to learn one query syntax.
- Faster Investigations: Queries spanning metrics, logs, traces, and entities become simpler to compose.
- Better Tooling Ecosystem: Dashboards, analytics, and automation can standardize on one language, creating richer integrations and less duplication of effort.
Perses: A Next-Generation Dashboarding Tool
Observability doesn’t stop at collecting and querying data. The final step is making insights accessible to everyone—from SREs to executives. This is where Perses comes in.
Modern, Extensible Dashboards
Perses provides a flexible way to visualize metrics, logs, traces, and (in the future) entity relationships, offering a smooth user experience for building interactive dashboards.
Collaboration-First Approach
Built with a mindset of dashboards as code, Perses allows teams to version-control their dashboards, share best practices, and maintain consistent Observability standards across environments.
Scalable and Cloud-Native
Perses is designed with cloud-native environments in mind, ensuring it can scale to handle large data volumes and integrate well with Kubernetes and other CNCF projects.
Unified Query Language Support
As the community converges on a single query language for Observability, Perses aims to integrate these capabilities natively. This paves the way for dashboards that can seamlessly pull in data from various backends and highlight relationships between different entities.
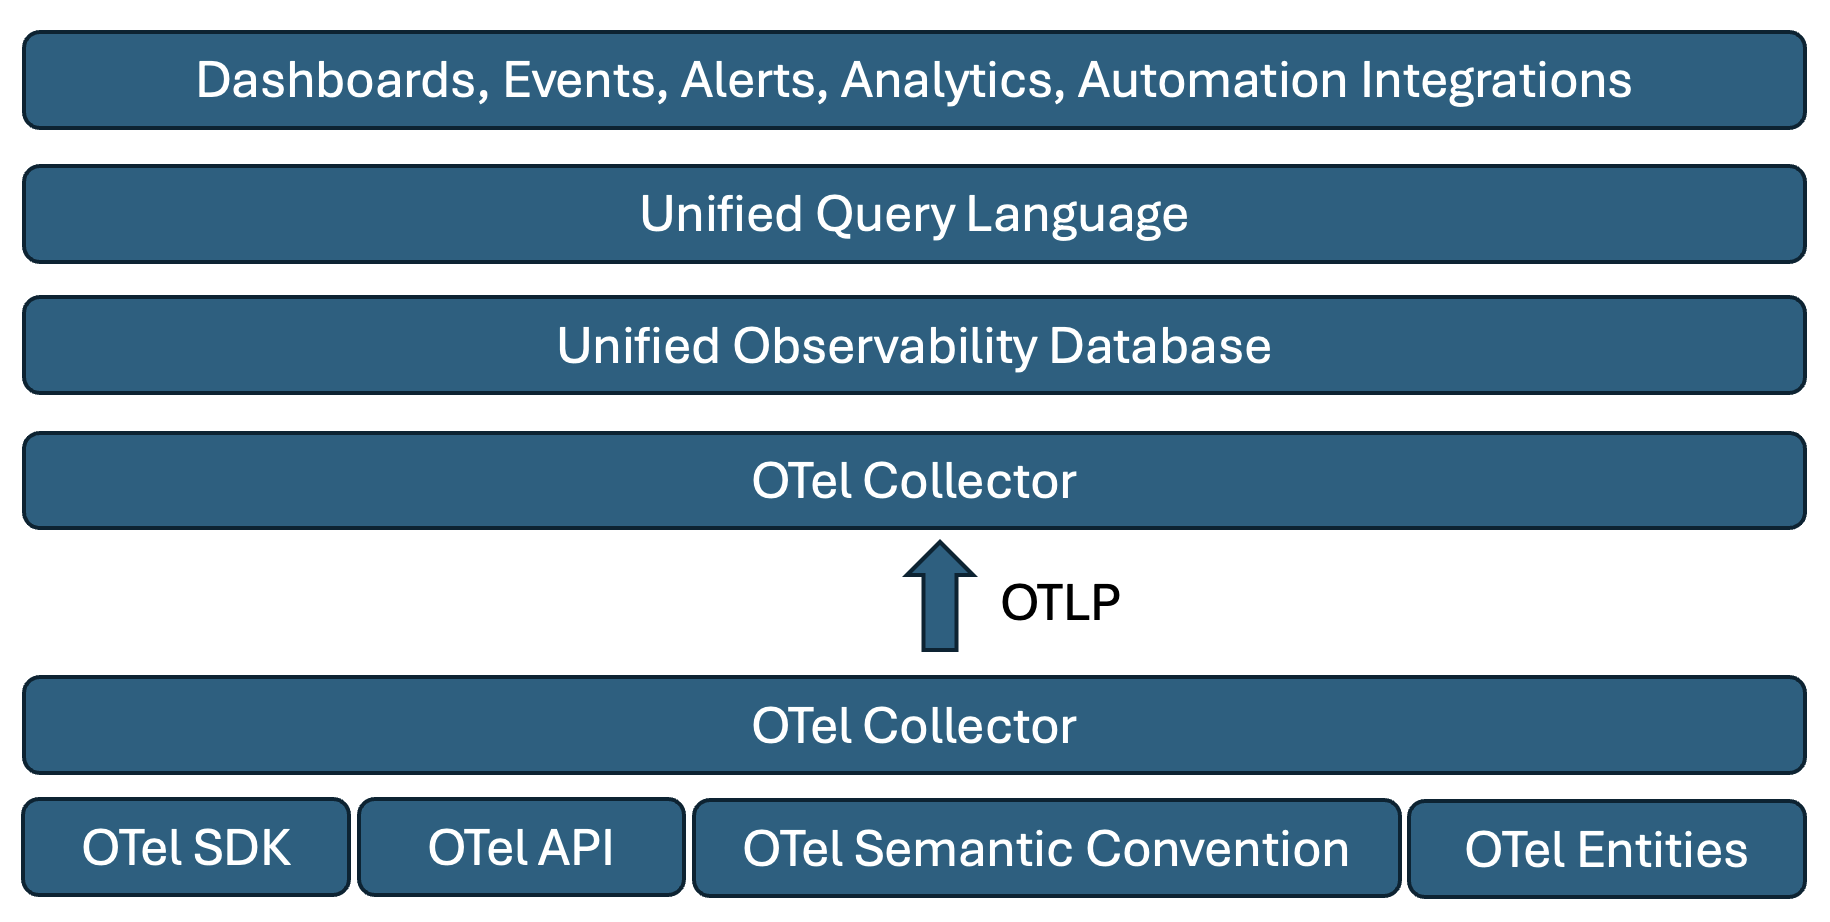
Putting It All Together: OTel Native + CNCF Ecosystem
Below is a conceptual architecture that highlights how these pieces fit into an open Observability strategy:
- OTel SDK & APIs: Instrument your applications using language-specific OTel libraries.
- Entity Modeling: Leverage OpenTelemetry Entities to define relationships between resources, providing richer context for analytics and troubleshooting.
- OTel Collector & Pipelines: Collect, process, and export telemetry data (metrics, logs, traces, entities) via OTLP or other supported protocols.
- Unified Observability Database: Store data in backends that align with CNCF standards (e.g., Prometheus, Loki, Tempo) or a single consolidated data store.
- Unified Query Language: Query your data—regardless of where it’s stored or what type it is—reducing context switching and complexity.
- Perses Dashboards: Present actionable insights through modern, collaborative dashboards, ensuring both technical and non-technical stakeholders have real-time visibility.
- Alerting, Analytics, Automation: Layer on advanced capabilities—like anomaly detection or automated remediation—to proactively address issues before they escalate.
Key Benefits of an Open, CNCF-Driven Observability Approach
Community-Driven Innovation
By leveraging CNCF projects and TAG Observability guidelines, you tap into a global community of experts and contributors continuously improving tools and standards.
No Vendor Lock-In
OpenTelemetry and other CNCF Observability projects let you swap out backends or visualization tools without re-instrumenting your entire stack.
End-to-End Visibility
A consistent data model, protocol, and query language ensure you can trace a request from user interaction to backend services, correlating metrics, logs, and traces in one place—now with the added dimension of entity relationships.
Scalability and Reliability
CNCF projects are designed for cloud-native environments, meaning they’re built to scale horizontally, handle container orchestration, and integrate seamlessly with Kubernetes.
Ecosystem Synergy
Observability is just one piece of the CNCF landscape. Projects like Kubernetes, Helm, and service meshes (e.g., Istio, Linkerd) all benefit from and enhance your Observability strategy.
Rich Context via Entities
By adopting OpenTelemetry Entities, teams gain a deeper understanding of how different services and resources relate to one another, streamlining troubleshooting and optimizing performance across complex microservice architectures.
Practical Steps to Get Started
- Join CNCF TAG Observability
- Explore TAG Observability’s GitHub to learn about current initiatives and working groups.
- Attend community meetings to stay updated on new proposals, standards, and best practices.
- Adopt OpenTelemetry
- Begin instrumenting your applications with the appropriate OTel SDKs.
- Use the OpenTelemetry Collector to build flexible Observability pipelines.
- Keep an eye on the OpenTelemetry Entities OTEPs for emerging features around resource relationships.
- Try Perses for Dashboards
- Experiment with Perses to create modern, version-controlled dashboards.
- Collaborate with your team to standardize Observability visuals and share best practices.
- Embrace a Unified Query Approach
- Track developments in unified query languages for Observability.
- Experiment with early prototypes or community-driven tools that aim to unify metrics, logs, traces, and entity queries.
- Automate and Alert
- Once you have consistent data, dashboards, and entity relationships, integrate alerting systems and automation workflows.
- Leverage machine learning or advanced analytics where appropriate to detect anomalies and prevent incidents proactively.
Looking Ahead
The CNCF ecosystem—and Observability specifically—is moving toward a future defined by openness, standardization, and collaboration. Key trends to watch include:
- Wider Adoption of OpenTelemetry: Expect more languages, frameworks, and platforms to offer built-in OTel support.
- Unified Query Language Maturity: As the community coalesces around a single query language, watch for new tools and features that simplify multi-data-type (and entity-centric) analysis.
- Deeper Entity Integration: OTel Entities will evolve, enabling richer, automated discovery and visualization of resource relationships.
- Perses Evolution: Perses will likely grow in features and integrations, providing a robust alternative or complement to existing dashboard solutions.
- Deeper Ecosystem Integrations: Expect further alignment between Observability and other CNCF projects like service meshes, security tools, and GitOps workflows.
Conclusion
The future of Observability is unquestionably open driven by community collaboration, vendor-neutral standards, and a desire for seamless interoperability across the stack. CNCF TAG Observability stands at the forefront of this movement, guiding best practices and fostering innovation in projects like OpenTelemetry, Perses and the query language etc. By embracing these open tools and standards—especially as OpenTelemetry expands to encompass entities organizations can reduce complexity, avoid vendor lock-in, and gain a comprehensive view of their cloud-native environments.
- Ready to dive deeper?
- Visit the CNCF TAG Observability GitHub to join discussions and working groups.
- Check out OpenTelemetry for instrumentation and watch for entity-based enhancements.
- Explore Perses for modern, collaborative dashboards.
With the cloud-native community working together, the path to scalable, resilient, and truly open Observability has never been clearer.